 (2)")


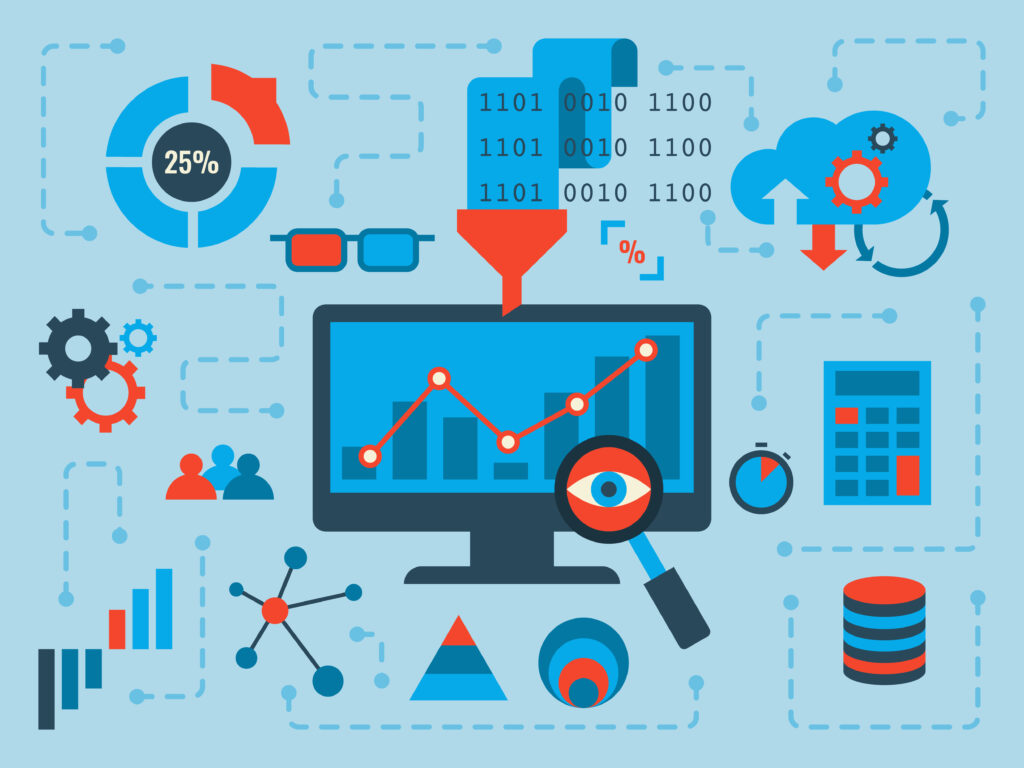
Drowning in data but thirsty for insights? You’re not alone. Smart businesses are leveraging Business Analytics Tools to turn their data deluge into a competitive advantage. Discover the top 10 platforms used by businesses today to improve decision-making, boost efficiency, and skyrocket your competitive edge!
What is Business Analytics?
Business analytics is the process of collecting, organizing, analyzing, and interpreting data to gain insights that can be used to make informed business decisions. It involves using statistical and quantitative analysis techniques to extract meaningful insights from data, such as identifying trends, patterns, and correlations.
What are Business Analytics Tools?
Business Analytics Tools are software applications and platforms designed to help organizations collect, process, analyze, and visualize large volumes of data. These tools enable businesses to:
- Extract meaningful insights from complex datasets
- Identify trends and patterns
- Make data-driven decisions
- Predict future outcomes
- Optimize business processes
They typically incorporate features such as:
- Data mining
- Statistical analysis
- Predictive modeling
- Data visualization
- Real-time reporting
- Machine learning algorithms
From simple spreadsheet applications to sophisticated AI-powered platforms, business analytics tools cater to the diverse needs of businesses of all sizes and industries.
Business Analytics VS Business Intelligence: What’s the Difference?
Business intelligence and business analytics are two sides of the data analysis coin, but they focus on different things:
- Business intelligence (BI) is all about the “what” and “where now?” It uses historical data to understand current business performance and identify trends. Think of it as a dashboard showing sales figures or website traffic.
- Business analytics (BA) “why” and looks to the future. It digs into the “what” from BI to uncover causes and predict what might happen next. BA helps you make data-driven decisions and optimize for future success.
Think of BI as the rearview mirror, giving you a clear view of the road behind. BA is your forward-facing windshield, helping you navigate the road ahead. Learn How Business Intelligence (BI) Tools Help Businesses Evolve & Adapt?
Various Business Analysis Tool Types
Business analysis tools vary widely, each addressing specific aspects of the process. Here’s a breakdown of the different types:
-
Requirement Gathering Tools
These tools streamline the process of collecting and documenting stakeholder requirements. They facilitate communication, ensure requirements are clear and well-defined, and help track changes throughout the project lifecycle.
- Examples: Jira, Azure Boards, Jama Connect
-
Data Analysis & Visualization Tools
These tools help you transform raw data into understandable insights. They allow you to explore trends, identify patterns, and create clear and compelling data visualizations like charts, graphs, and dashboards.
- Examples: Microsoft Power BI, Tableau, QlikView, Google Data Studio
-
Modeling Tools
These tools help create visual representations of business processes, data flows, and system architectures. They improve communication, identify potential issues early on, and ensure everyone involved has a clear understanding of the system.
- Examples: Microsoft Visio, Lucidchart, Bizagi Modeler
-
Project Management Tools
These tools help manage project tasks, timelines, resources, and communication. They facilitate collaboration, keep projects on track, and ensure everyone is accountable for their deliverables.
- Examples: Asana, Trello, Monday.com, Microsoft Planner
-
Communication & Collaboration Tools
These tools facilitate communication and collaboration among team members and stakeholders. They allow for real-time discussions, document sharing, and feedback exchange.
- Examples: Slack, Microsoft Teams, Zoom, Google Meet
-
Mind Mapping & Brainstorming Tools
These tools help capture ideas visually, organize thoughts, and stimulate creative thinking during brainstorming sessions.
- Examples: Miro, XMind, MindMeister
By choosing the most appropriate tools, you can streamline your business analysis process, improve decision-making, and achieve better project outcomes.
Key Features to look for in Business Analytics Tools
When evaluating Business Analytics Tools, key features to look for include:
- Data Integration: Ability to connect and import data from various sources seamlessly.
- Data Visualization: Intuitive dashboards and customizable charts for clear data representation.
- Predictive Analytics: Machine learning capabilities for forecasting trends and outcomes.
- Real-time Analytics: Up-to-the-minute data processing for timely decision-making.
- Scalability: Capacity to handle growing data volumes and user bases.
- User-friendly Interface: Intuitive design for both technical and non-technical users.
- Collaboration Tools: Features that allow team members to share insights and work together.
- Customization Options: Flexibility to tailor reports and dashboards to specific needs.
- Mobile Accessibility: Access to analytics on various devices for on-the-go insights.
- Security Features: Robust data protection and user access controls.

List of Top 10 Business Analytics Tools For All Business Types
Here’s a list of popular business analytics tools, well-regarded for their features and catering to a wide range of businesses:
-
Microsoft Power BI
Power BI is a powerful data visualization and business intelligence tool that allows users to create interactive reports and dashboards. It offers a range of features including data preparation, data discovery, and real-time analytics.
Key Features:
- Intuitive drag-and-drop interface for creating visualizations
- Ability to connect to multiple data sources
- Real-time analytics and dashboards
- Collaboration and sharing capabilities
Pros:
- Easy to use and learn
- Integrates well with other Microsoft products
- Affordable pricing options
Cons:
- Limited customization options compared to some other tools
- May require additional tools for advanced analytics
-
Tableau
Tableau is a leading data visualization tool that allows users to create interactive dashboards and reports. It offers advanced analytics capabilities and is known for its ease of use.
Key Features:
- Drag-and-drop interface for creating visualizations
- Wide range of chart types and visualization options
- Advanced analytics including predictive modeling
- Ability to connect to multiple data sources
Pros:
- Intuitive and user-friendly interface
- Powerful analytics capabilities
- Extensive visualization options
Cons:
- Can be expensive, especially for larger organizations
- May require IT support for advanced deployments
-
QlikView
QlikView is a business intelligence platform that offers in-memory data processing and associative data indexing. It allows users to create interactive dashboards and perform advanced analytics.
Key Features:
- Associative data indexing for fast analysis
- In-memory data processing for high performance
- Ability to create interactive dashboards and reports
- Advanced analytics including predictive modeling
Pros:
- Fast performance due to in-memory processing
- Powerful analytics capabilities
- Flexible and customizable
Cons:
- Steeper learning curve compared to some other tools
- Can be expensive for smaller organizations
-
SAS
SAS is a comprehensive business analytics platform that offers a wide range of tools for data management, analytics, and reporting. It is known for its advanced analytics capabilities and is widely used in large enterprises.
Key Features:
- Wide range of analytics techniques including machine learning and AI
- Data management tools for preparing and cleansing data
- Reporting and visualization capabilities
- Ability to handle large and complex datasets
Pros:
- Powerful analytics capabilities
- Scalable and enterprise-ready
- Extensive support and training resources
Cons:
- Steep learning curve and complex interface
- Can be expensive, especially for smaller organizations
-
IBM Cognos Analytics
IBM Cognos Analytics is a business intelligence platform that offers self-service data preparation, interactive dashboards, and advanced analytics. It is known for its enterprise-grade security and scalability.
Key Features:
- Self-service data preparation tools
- Interactive dashboards and reports
- Advanced analytics including predictive modeling
- Enterprise-grade security and governance
Pros:
- Scalable and secure for large enterprises
- Wide range of analytics and reporting capabilities
- Integrates well with other IBM products
Cons:
- Can be complex and difficult to set up
- Expensive, especially for smaller organizations
-
Sisense
Sisense is a business intelligence platform that offers in-chip analytics and data blending capabilities. It allows users to create interactive dashboards and perform advanced analytics on large and complex datasets.
Key Features:
- In-chip analytics for fast performance
- Data blending capabilities to combine data from multiple sources
- Ability to create interactive dashboards and reports
- Advanced analytics including predictive modeling
Pros:
- Fast performance due to in-chip analytics
- Flexible and customizable
- Ability to handle large and complex datasets
Cons:
- Can be expensive, especially for larger organizations
- May require IT support for advanced deployments
-
Zoho Analytics
Zoho Analytics is a self-service business intelligence tool that offers data preparation, interactive dashboards, and advanced analytics. It is known for its ease of use and affordability.
Key Features:
- Self-service data preparation tools
- Interactive dashboards and reports
- Advanced analytics including predictive modeling
- Ability to connect to multiple data sources
Pros:
- Easy to use and learn
- Affordable pricing options
- Wide range of features and capabilities
Cons:
- May lack some of the advanced features of enterprise-grade tools
- Limited customization options compared to some other tools
-
Google Data Studio
Google Data Studio is a free business intelligence tool that allows users to create interactive reports and dashboards. It integrates with other Google products and offers a range of visualization options.
Key Features:
- Free and easy to use
- Integrates with other Google products
- Wide range of visualization options
- Ability to connect to multiple data sources
Pros:
- Free and easy to use
- Integrates well with other Google products
- Wide range of visualization options
Cons:
- Limited advanced analytics capabilities compared to some other tools
- May lack some of the enterprise-grade features of paid tools
-
Domo
Domo is a cloud-based business intelligence platform that offers a range of features including data preparation, interactive dashboards, and advanced analytics. It is known for its ease of use and mobile-first design.
Key Features:
- Cloud-based platform with mobile-first design
- Self-service data preparation tools
- Interactive dashboards and reports
- Advanced analytics including predictive modeling
Pros:
- Easy to use and learn
- Mobile-friendly design
- Wide range of features and capabilities
Cons:
- Can be expensive, especially for larger organizations
- May require IT support for advanced deployments
-
Looker
Looker is a business intelligence platform that offers data exploration, interactive dashboards, and advanced analytics. It is known for its ability to create custom data applications and embed analytics into other applications.
Key Features:
- Data exploration and discovery tools
- Interactive dashboards and reports
- Advanced analytics including predictive modeling
- Ability to create custom data applications
Pros:
- Powerful data exploration and discovery tools
- Ability to embed analytics into other applications
- Wide range of advanced analytics capabilities
Cons:
- Can be complex and difficult to set up
- Expensive, especially for smaller organizations
Please note that these software solutions and their features are subject to change, and it’s always recommended to thoroughly research and evaluate each option based on your specific organizational needs and requirements.

Need help choosing the best Business Analytics Tools for your company?
Look no further than StaQ.ai, the revolutionary SaaS marketplace that connects you with the perfect software solutions tailored to your unique needs.
With StaQ.ai, you can explore a curated selection of top-tier SaaS products, each offering free trials to help you make informed decisions. Our user-friendly platform makes it easy to compare features, pricing, and customer reviews, empowering you to find the software that will streamline your operations, boost productivity, and drive growth.
Discover your perfect business analytics tool today!